

In this article, we will dive deep into four fundamental model evaluation metrics: Accuracy, Precision, Recall, and F1 Score. We will learn what each metric measures, how it is calculated, and when it should be used. Additionally, you'll understand why trusting only accuracy can be a critical mistake.
What are these metrics?
These metrics are generally used for evaluating the performance of classifications models. They compare and analyze the real classification and predicted classification with some kind of mathematical formulas -- Don't worry I will explain them. Before we dive into these metrics, we first should understand the confusion matrix which forms the foundation for almost all model evaluation metrics.
Confusion Matrix?
The fundamental structure of confusion matrix was created in the 1950s. Those years, it was used to measure the accuracy of diagnostic tests by psychologists and medical researchers. Today, we are using this matrix to evaluate our classification models.
How it is work?
Let's assume that we are developing a diagnostic test to detect whether a patient has COVID-19. We need to evaluate the accuracy of this test by comparing predictions against the actual health status of the patients. In other words, we want to see how well the test can correctly identify who truly has the virus and who does not. Now, it is time to use confusion matrix.
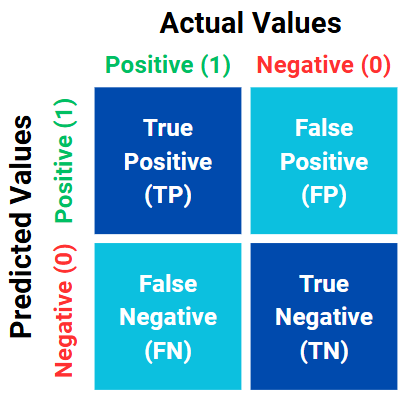
Figure 1. Example of basic confusion matrix.
In our problem, we can use a basic confusion matrix as shown in Figure 1. In this matrix the darker blue is the correct result which means test and the actual status is same. On the other hand the light blues is the wrong results which means test and actual status are different.
- True Positive (TP): The patient is sick, and the test results say the patient is sick. So, the test is correct✅. In true positive, we expect if that is true in actual it must to true in predictions. Yeah I know sick means bad and carries a negative meaning. However we are not concerned with whether the condition is good or bad. In the examples, we simply focus on the existence of the condition. If the condition is present, it's considered a positive result, regardless of how we feel about it.
- False Positive (FP): The patient isn't sick, and the test results say the patient is sick. The test is incorrect❌.
- False Negative (FN) The patient is sick, and the test results say the patient isn't sick. The test is incorrect❌.
- True Negative (TN) The patient isn't sick, and the test results say the patient isn't sick. The test is correct✅.
Well, maybe you're feeling a bit confused about the confusion matrix 😄. Don't worry, there is actually a simple way to remember it!
- If it is include True that means prediction and actual are matched.
- If it is include False that means prediction and actual are not matched.
- If it is include negative that means it is about negative results of predicitons.
- If it is include positive that means it is about positive result of predictions.
Accuracy
Accuracy is the most fundamental performance metric that measures how many of a model’s predictions are correct. Shortly, it is the ratio of the model’s correct predictions to the total number of predictions as shown in Equation 1.
$$ \text{Accuracy} = \frac{TP + TN}{TP + TN + FP + FN} \quad (1) $$
Now we've reached the most important point: having a high accuracy does not always mean that the model is good. You might ask, "What do you mean? If it's mostly correct, isn't it a good model?" Well, not necessarily! It all comes down to one thing: an imbalanced dataset.
In the COVID-19 example we mentioned earlier, imagine that the dataset consists of 95% healthy individuals and only 5% sick individuals. Even if the model simply predicts "healthy" for everyone, the accuracy would still be 95%. At first, the model might look like it's doing a great job but in truth, it completely misses identifying the sick patients. This is a classic example of how an imbalanced dataset can lead to misleading conclusions.
In contrast, if there were 500 sick and 500 healthy individuals in the dataset, a high accuracy would genuinely indicate that the model is performing well.
Precision
In precision, we focus on the accuracy of the model's positive predictions. In other words, we only look at the relationship between the predicted positive cases. In our example, a "positive" means that the person is sick. We evaluate precision by checking whether the model’s prediction ("this person is sick") actually matches the true condition of the patient. The precision formula is shown in Equation 2. Moreover, precision is simply the ratio of the True Positive (TP) to the total yellow circle which shown in Figure 2.
$$ \text{Precision} = \frac{TP}{TP + FP} \quad (2) $$
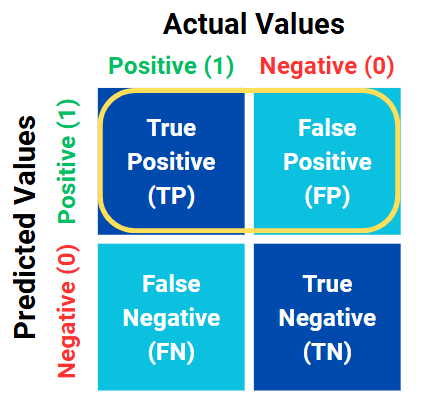
Figure 2. Variables of the precision.
Precision is important when false positives are costly, risky, or dangerous. It is mainly used in email spam detection, fraud detection, and medical diagnosis to avoid incorrect results. It should be high for these situations.
Recall
In recall, we measure how successfully the model captures the actual positive cases. While precision focuses on the model’s positive predictions, recall looks at the actual positive instances and evaluates how the model has classified them. The precision formula is shown in Equation 3. Moreover, precision is simply the ratio of the True Positive (TP) to the total pink circle which shown in Figure 3.
$$ \text{Recall} = \frac{TP}{TP + FN} \quad (3) $$
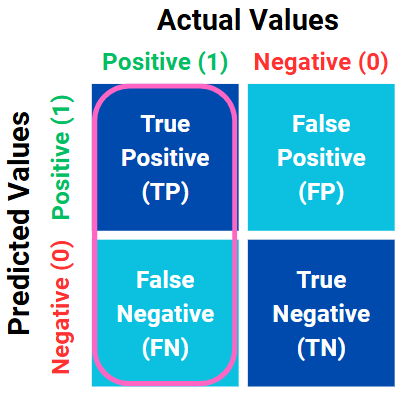
Figure 3. Variables of the recall.
F1-Score
When only Precision or Recall is high, the model’s overall performance might not accurately reflect reality. F1 Score is a metric that measures both Precision and Recall together and balances them. The F1 Score formula is shown in Equation 4.
$$ F1 = 2 \times \frac{\text{Precision} \times \text{Recall}}{\text{Precision} + \text{Recall}} \quad (4) $$
In imbalanced datasets such as dataset consists of 95% healthy individuals and only 5% sick individuals, F1 Score can provide a more accurate evaluation of a model’s performance compared to Accuracy.
Example with Numbers
Let's say we have a dataset consisting of 95% healthy individuals and only 5% sick individuals, as mentioned earlier. The dataset contains 1,000 people, and we have built a model to make predictions. The confusion matrix for the model’s prediction scenario is shown in Figure 4.
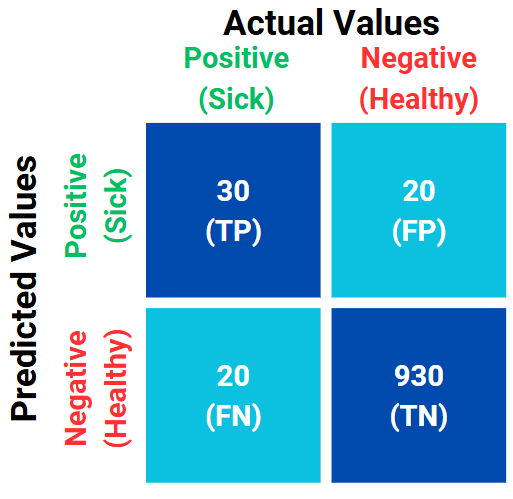
Figure 4. Confusion matrix of model.
Now, lets calculate all the metrics:
$$ \text{Accuracy} = \frac{30 + 930}{30 + 930 + 20 + 20} = \frac{960}{1000} = 0.96 $$
$$ \text{Precision} = \frac{30}{30 + 20} = \frac{30}{50} = 0.6 $$
$$ \text{Recall} = \frac{30}{30 + 20} = \frac{30}{50} = 0.6 $$
$$ \text{F1 Score} = 2 \times \frac{0.6 \times 0.6}{0.6 + 0.6} = 2 \times \frac{0.36}{1.2} = 2 \times 0.3 = 0.6 $$
As shown in the results, although the model appears to be 96% accurate based on Accuracy, its prediction capabilities are not as perfect when evaluated with the F1 Score. In this case, the F1 Score provides a more realistic reflection of the model’s true performance.
Example of Python Code
We can use scikit-learn library to calculate accuracy, preicison, recall and F1 score in python.
Let's say we developed a model and want to calculate its performance using these metrics. We can use below code.
from sklearn.metrics import accuracy_score, precision_score, recall_score, f1_score
# Real Values
y_true = [0, 0, 0, 0, 0, 0, 1, 1, 1, 1, 0, 0, 0, 0, 0, 0, 0, 1, 1, 1]

# Model Prediction
y_pred = [0, 0, 0, 0, 0, 0, 0, 0, 1, 0, 0, 0, 0, 0, 0, 0, 1, 0, 1, 0]

# Accuracy, Precision, Recall, F1 Score
accuracy = accuracy_score(y_true, y_pred)
precision = precision_score(y_true, y_pred)
recall = recall_score(y_true, y_pred)
f1 = f1_score(y_true, y_pred)
# Print Results
print(f"Accuracy: {accuracy:.2f}")
print(f"Precision: {precision:.2f}")
print(f"Recall: {recall:.2f}")
print(f"F1 Score: {f1:.2f}")
Result is:
Accuracy: 0.70
Precision: 0.67
Recall: 0.29
F1 Score: 0.40
Moreover, you can plot the confusion matrix as shown in below code.
from sklearn.metrics import confusion_matrix
# Confusion matrix
cm = confusion_matrix(y_true, y_pred)
labels = np.array([['TN', 'FP'], ['FN', 'TP']])

fig, ax = plt.subplots(figsize=(6,6))
cax = ax.matshow(cm, cmap="Blues")
for (i, j), val in np.ndenumerate(cm):
    ax.text(j, i, f'{labels[i, j]}\n{val}', ha='center', va='center', fontsize=14, color='black')

ax.set_xlabel('Predicted', fontsize=14)
ax.set_ylabel('Actual', fontsize=14)
ax.set_xticks([0, 1])
ax.set_yticks([0, 1])
ax.set_xticklabels(['Negative (0)', 'Positive (1)'])
ax.set_yticklabels(['Negative (0)', 'Positive (1)'])
fig.colorbar(cax)
plt.title('Confusion Matrix with Labels', fontsize=16)
plt.show()
Figure 5. Confusion matrix of Python result.
Conclusion
When working with imbalanced datasets, we’ve seen how relying only on accuracy can be misleading. Metrics like precision, recall, and F1 score help us better understand a model’s performance in such cases. We’ve also learned what a confusion matrix is and how these different evaluation metrics work. Keep these in mind as you move forward with your future projects!
If you enjoyed this content, feel free to follow me and share this article to help more people learn. Thanks for your support! 🙌